
Loading...
Please wait while we prepare your content
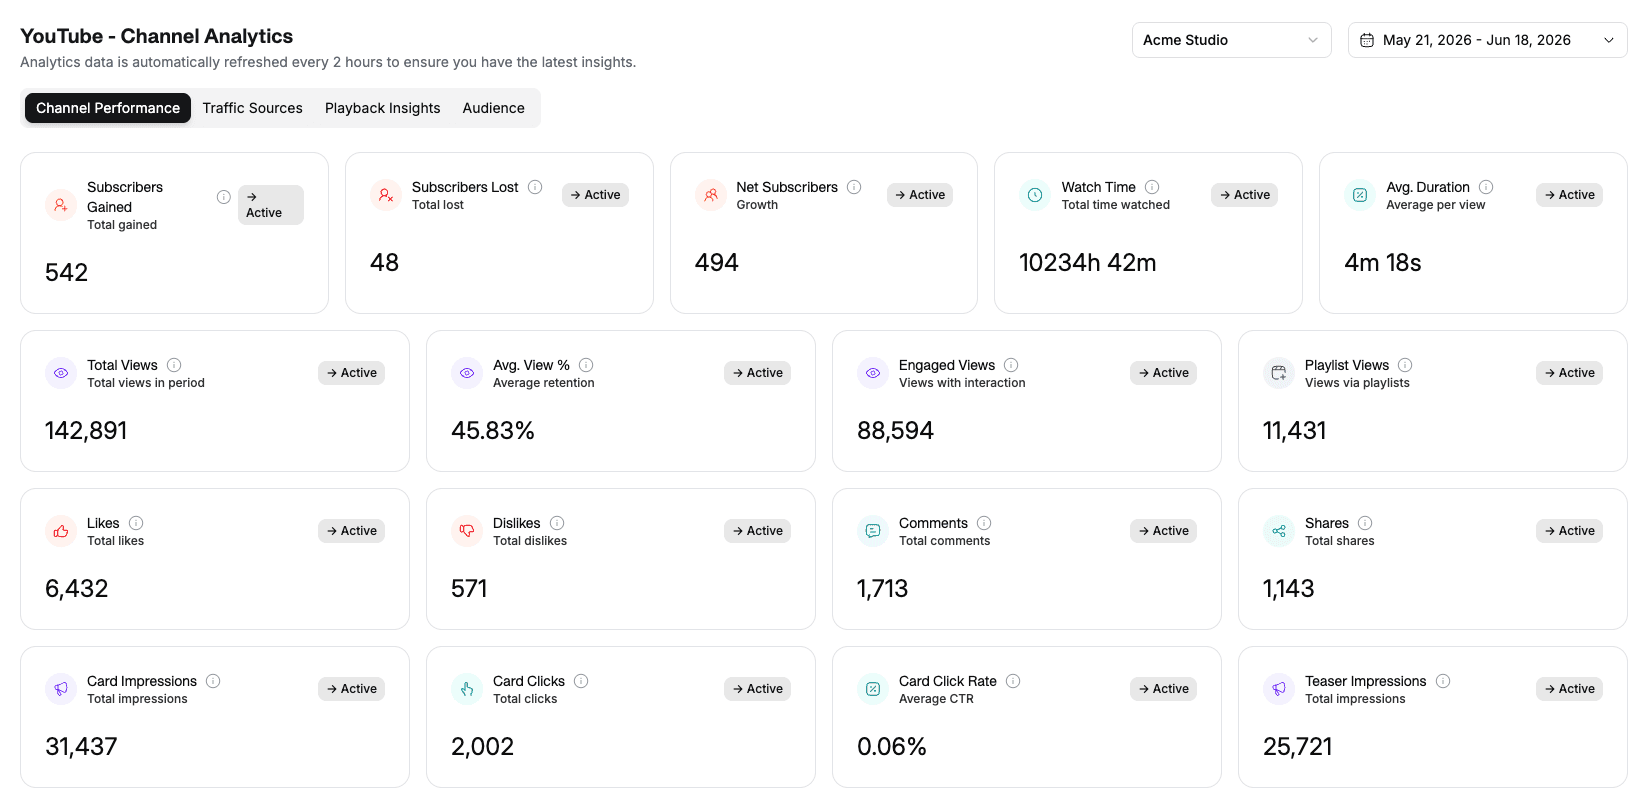
A Social Media Analytics Dashboard You'll Actually Open
Cross-platform analytics for Instagram, TikTok, YouTube, LinkedIn, Twitter/X, Facebook, Pinterest, WhatsApp, Bluesky, Mastodon, Reddit and Google Business Profile. One dashboard, period-over-period growth, no spreadsheets.
See your dashboardCross-platform dashboard
Every connected account on one screen — followers, engagement, reach, top posts and posting cadence.
Growth you can act on
Period-over-period deltas on account and post metrics, so you can see exactly what's trending up or down.
Best time to post
Personalized posting heatmaps per account, built from your real engagement history.
Single-post analytics
Drill into any published post for unified metrics with growth versus the previous period.
One social media analytics dashboard, every platform
Forget logging into a dozen native analytics pages. So-me Studio stacks Twitter/X, Facebook, Instagram, LinkedIn, TikTok, YouTube, Pinterest, WhatsApp, Bluesky, Mastodon, Reddit and Google Business Profile metrics on a single screen — followers, engagement, reach, impressions and top content.
- •Account-level metrics for 12 platforms
- •Per-account and per-Hub views
- •Period-over-period comparison built in
Unified analytics for any post
Click any published post to see its unified analytics — views, engagement, reach, comments and clicks — each metric annotated with period-over-period growth versus its last snapshot, so you know what's still climbing and what's cooling off.
- •Unified per-post metrics across platforms
- •Growth deltas vs. the previous period
- •Historical snapshots retained on connect

Post when your audience is actually online
So-me Studio turns your engagement history into a best-time-to-post heatmap for each connected account, then surfaces the recommended windows right in the calendar so you can schedule into them.
- •Personalized posting heatmaps per account
- •Recommended windows surfaced in scheduling
- •Platform-aware defaults until you build history

Built for everyone who's tired of native analytics tabs
Agencies
Track every client's accounts from one dashboard, with per-Hub isolation and exportable data.
Founders
Pull traction numbers for investor updates without screenshotting native dashboards.
Creators
Spot which posts actually drive growth, and post into your best windows from the heatmap.
In-house marketing
One dashboard for every social account your team runs, with growth deltas to show in reviews.
Account-level and post-level metrics — followers, engagement, reach, impressions, top posts and posting cadence — with period-over-period comparisons built in. You can drill into any single post for unified analytics with growth deltas, and export the underlying data to CSV or spreadsheet.
Twitter/X, Facebook, Instagram, LinkedIn, TikTok, YouTube, Pinterest, WhatsApp, Bluesky, Mastodon, Reddit and Google Business Profile — 12 platforms in all. All metrics are pulled via the official platform APIs.
Yes. Click any published post to open its unified analytics — views, engagement, reach, comments and link clicks — with each metric annotated with growth versus the previous period.
Yes. So-me Studio builds a best-time-to-post heatmap for each connected account from your real engagement history and surfaces the recommended windows in the scheduler. Until you've built up history, platform-aware defaults fill the gap.
We pull as much history as each platform's API allows when you connect an account. From that point on, So-me Studio captures point-in-time snapshots to your own R2/S3 analytics storage, so period-over-period growth comparisons keep working as data accumulates.
Yes. You can export the underlying analytics data to CSV or spreadsheet for use outside the app. Cross-Hub dashboards let agencies and teams review every workspace from one place.
Schedule once.
Post everywhere.
Stop juggling tabs — draft, customize, and publish to 20 platforms from a single calendar.